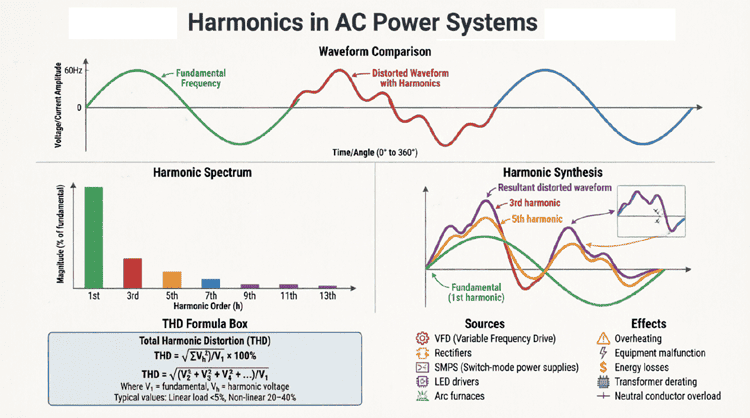
Crest Factor of a Waveform
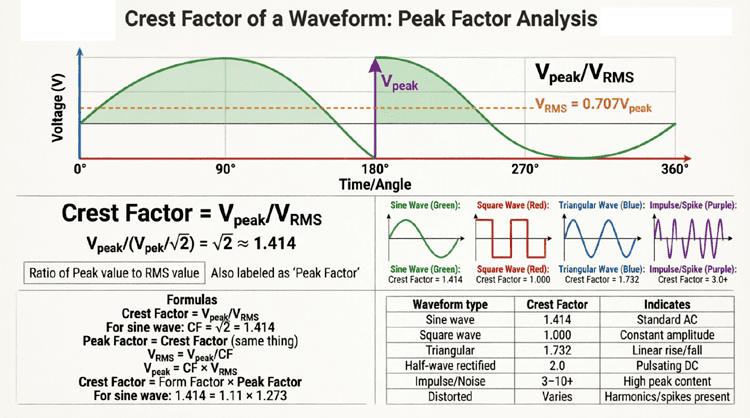
Crest Factor of a Waveform: Peak Factor Analysis
Introduction to Crest Factor
In electrical engineering and signal processing, crest factor (also known as peak factor) is a critical parameter that quantifies the relationship between a waveform’s peak amplitude and its RMS (root mean square) value. This dimensionless ratio reveals how “peaky” or extreme the peaks of a waveform are relative to its average power content.
Crest factor is essential in numerous applications:
- Audio Engineering: Determining dynamic range and preventing clipping
- Power Systems: Sizing equipment for peak currents and voltages
- Signal Processing: Setting appropriate gain stages and avoiding distortion
- Instrumentation: Selecting meters with adequate dynamic range
- Telecommunications: Optimizing transmitter power and linearity
- Motor Drives: Designing inverters and protecting semiconductors
A high crest factor indicates a waveform with sharp, narrow peaks relative to its RMS value—like a drum hit in audio or a current spike in a motor drive. A low crest factor indicates a more constant amplitude—like a square wave or continuous sine tone.
Understanding crest factor is crucial for designing systems that can handle peak demands without distortion or damage while maintaining efficiency during normal operation. This comprehensive guide will explore crest factor from every angle, including mathematical derivations, values for different waveforms, practical applications, and measurement techniques.
What is Crest Factor?
Crest factor (or peak factor) is the ratio of a waveform’s peak amplitude to its RMS value. For a pure sine wave, the crest factor is 2 ≈ 1.414. It indicates how extreme the peaks are relative to the waveform’s heating effect or power content.
Understanding Crest Factor: Definition and Significance
Mathematical Definition
Crest Factor (CF) is defined as the ratio of the peak (maximum) value to the RMS value of a waveform:
$CF = \frac{V_{peak}}{V_{RMS}}$
Or for current:
$CF = \frac{I_{peak}}{I_{RMS}}$
Where:
- $V_{peak}$ = Peak (maximum) amplitude of the waveform
- $V_{RMS}$ = RMS (effective) value of the waveform
- CF = Crest factor (dimensionless, ≥ 1.0)
Alternative Names:
- Peak Factor
- Peak-to-RMS Ratio
- Amplitude Factor
Why Crest Factor Matters
Crest factor provides critical insights into waveform characteristics:
1. Equipment Sizing:
- Transformers, amplifiers, and power supplies must handle peak voltages/currents
- High crest factor requires larger safety margins
- Insulation must withstand peak voltages
2. Dynamic Range Requirements:
- Audio systems need headroom for peaks
- ADCs (analog-to-digital converters) need sufficient bit depth
- Prevents clipping and distortion
3. Power Quality:
- High crest factor indicates harmonic distortion or transients
- Affects motor and transformer performance
- May cause nuisance tripping of protective devices
4. Measurement Accuracy:
- Meters must have adequate crest factor rating
- Low-CF meters give errors on peaky waveforms
- Important for accurate power measurements
5. Efficiency Considerations:
- High crest factor waveforms waste capacity
- Amplifiers run less efficiently
- Increased heat dissipation
Relationship to Other Parameters
Crest factor relates to other waveform parameters:
Form Factor:
$FF = \frac{V_{RMS}}{V_{avg}}$
Peak-to-Average Ratio:
$\frac{V_{peak}}{V_{avg}} = CF \times FF$
Ripple Factor (for rectified waveforms):
$RF = \sqrt{FF^2 – 1}$
Together, these parameters provide a complete characterization of waveform shape.
What is the crest factor of a pure sine wave?
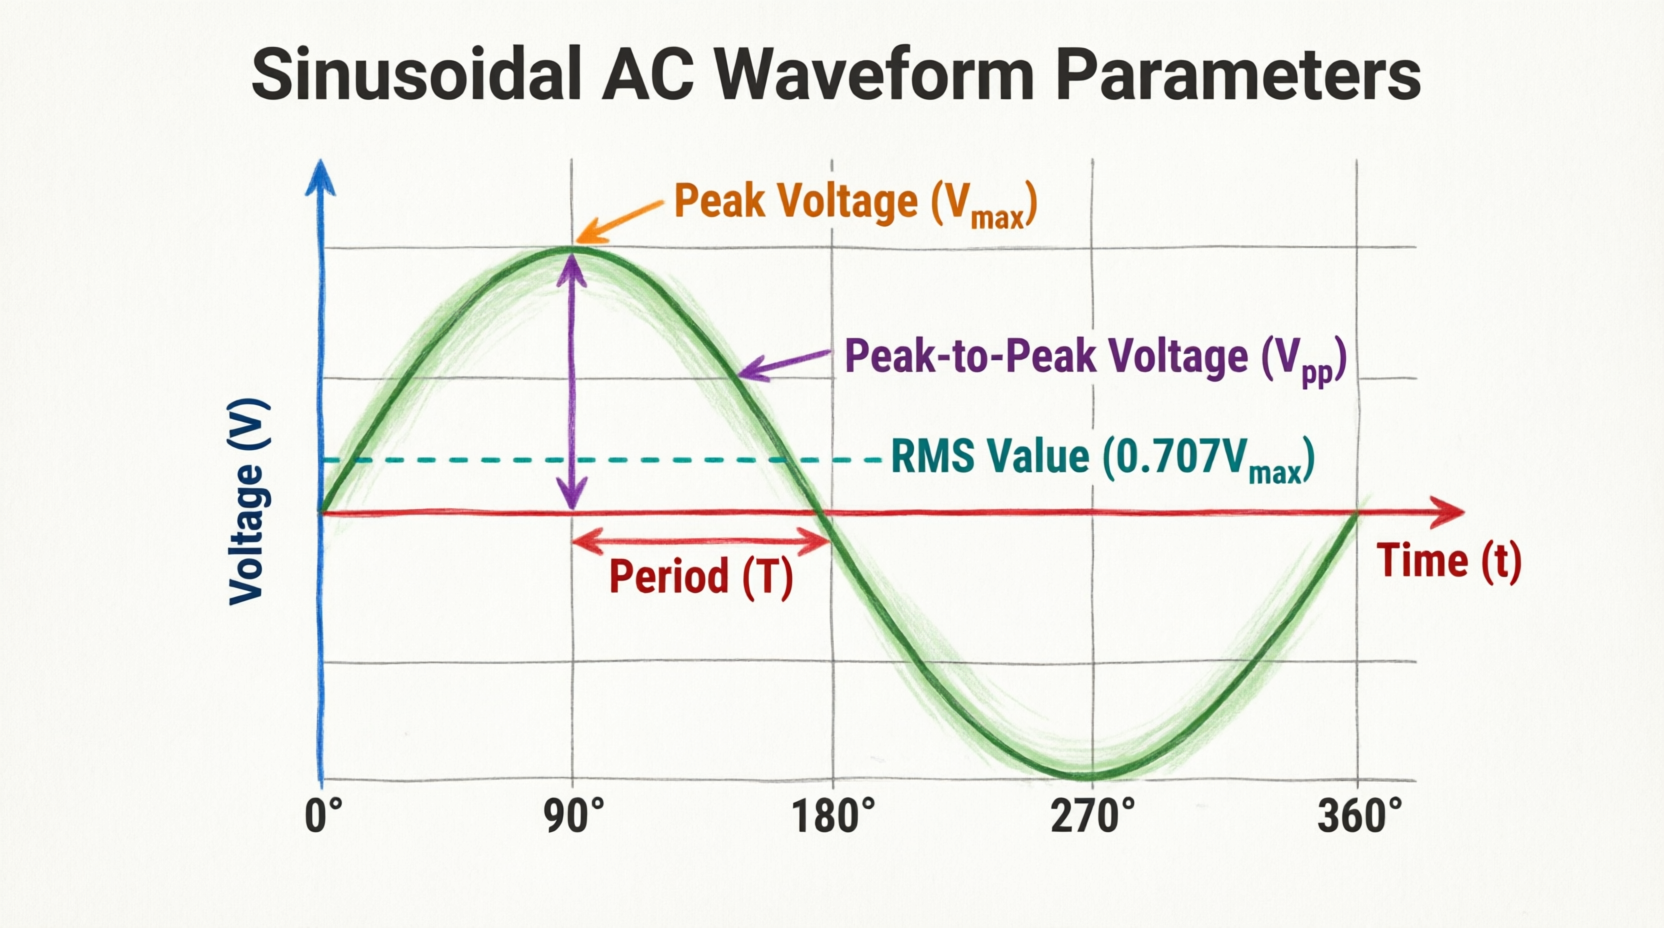
The crest factor of a pure sine wave is √2 ≈ 1.414. This means the peak value is 1.414 times the RMS value. For example, a 120V RMS sine wave has a peak of 170V (120 × 1.414).
Crest Factor of Common Waveforms
Different waveform shapes have characteristic crest factors. Understanding these values helps in waveform identification and system design.
1. Sine Wave
Characteristics:
- Smooth, continuous oscillation
- Most common in AC power systems
- Symmetrical positive and negative halves
Calculation:
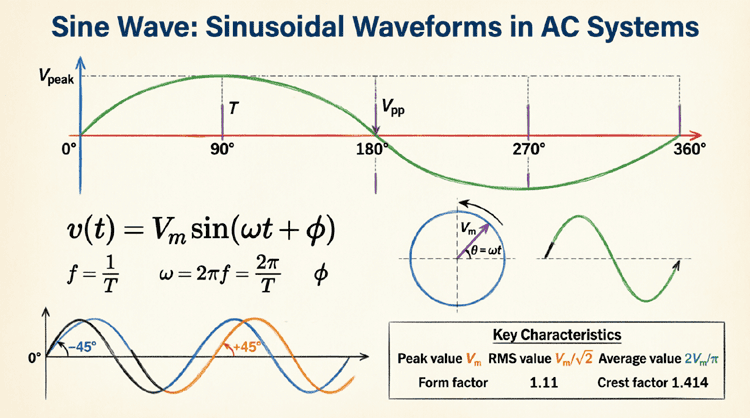
For $v(t) = V_m \sin(\omega t)$:
$V_{peak} = V_m$
$V_{RMS} = \frac{V_m}{\sqrt{2}}$
$CF = \frac{V_m}{V_m/\sqrt{2}} = \sqrt{2}$
Crest Factor: CF = 1.414
Interpretation: The sine wave has a moderate crest factor, balancing peak amplitude with continuous power delivery.
2. Square Wave
Characteristics:
- Constant amplitude
- Instantaneous transitions
- 50% duty cycle (symmetrical)
Calculation:
$V_{peak} = V_m$
$V_{RMS} = V_m$ (constant amplitude)
$CF = \frac{V_m}{V_m} = 1.0$
Crest Factor: CF = 1.0
Interpretation: The lowest possible crest factor. All the power is delivered at constant amplitude with no peaks.
3. Triangle Wave
Characteristics:
- Linear rise and fall
- Symmetrical waveform
- Continuous but with sharp corners
Calculation:
$V_{peak} = V_m$
$V_{RMS} = \frac{V_m}{\sqrt{3}}$
$CF = \frac{V_m}{V_m/\sqrt{3}} = \sqrt{3}$
Crest Factor: CF = 1.732
Interpretation: Higher than sine wave due to the linear shape concentrating energy near the peaks.
4. Sawtooth Wave
Characteristics:
- Linear rise, instantaneous fall (or vice versa)
- Asymmetrical
- Rich in harmonics
Calculation:
$V_{peak} = V_m$
$V_{RMS} = \frac{V_m}{\sqrt{3}}$
$CF = \sqrt{3}$
Crest Factor: CF = 1.732
Note: Same as triangle wave for symmetrical sawtooth.
5. Pulse Wave (Variable Duty Cycle)
Characteristics:
- Rectangular pulses
- Duty cycle D (fraction of period where signal is high)
- Zero during off periods
Calculation:
$V_{peak} = V_m$
$V_{RMS} = V_m \sqrt{D}$
$CF = \frac{V_m}{V_m \sqrt{D}} = \frac{1}{\sqrt{D}}$
Examples:
- D = 50% (0.5): $CF = \frac{1}{\sqrt{0.5}} = 1.414$
- D = 10% (0.1): $CF = \frac{1}{\sqrt{0.1}} = 3.162$
- D = 1% (0.01): $CF = \frac{1}{\sqrt{0.01}} = 10.0$
Interpretation: Narrower pulses have much higher crest factors, requiring significantly more headroom.
6. Half-Wave Rectified Sine Wave
Characteristics:
- Only positive half-cycles
- Zero during negative half-cycles
- Pulsating DC
Calculation:
$V_{peak} = V_m$
$V_{RMS} = \frac{V_m}{2}$
$CF = \frac{V_m}{V_m/2} = 2.0$
Crest Factor: CF = 2.0
Interpretation: Higher than sine wave due to the zero portions reducing RMS while peak remains the same.
7. Full-Wave Rectified Sine Wave
Characteristics:
- Both half-cycles converted to positive
- No zero portions
- Pulsating DC at 2× frequency
Calculation:
$V_{peak} = V_m$
$V_{RMS} = \frac{V_m}{\sqrt{2}}$
$CF = \frac{V_m}{V_m/\sqrt{2}} = \sqrt{2}$
Crest Factor: CF = 1.414
Note: Same as sine wave (absolute value doesn’t change peak-to-RMS ratio).
8. Complex Waveforms (Harmonics)
When harmonics are present, crest factor increases:
Example: Sine wave with 3rd harmonic:
$v(t) = V_1 \sin(\omega t) + V_3 \sin(3\omega t)$
If $V_3 = 0.3 V_1$ (30% 3rd harmonic):
- $V_{peak}$ increases due to harmonic addition
- $V_{RMS} = \sqrt{V_1^2 + V_3^2}$ increases less
- CF > 1.414 (typically 1.5-1.7)
General Rule: More harmonic distortion → higher crest factor.
Comparison Table
| Waveform | Peak Value | RMS Value | Crest Factor |
|---|---|---|---|
| Square Wave | $V_m$ | $V_m$ | 1.0 |
| Sine Wave | $V_m$ | $0.707V_m$ | 1.414 |
| Triangle Wave | $V_m$ | $0.577V_m$ | 1.732 |
| Sawtooth Wave | $V_m$ | $0.577V_m$ | 1.732 |
| Full-Wave Rectified | $V_m$ | $0.707V_m$ | 1.414 |
| Half-Wave Rectified | $V_m$ | $0.5V_m$ | 2.0 |
| Pulse (10% duty) | $V_m$ | $0.316V_m$ | 3.162 |
| Narrow Pulse (1%) | $V_m$ | $0.1V_m$ | 10.0 |
Which waveform has the highest crest factor?
Waveforms with narrow pulses or spikes have the highest crest factors. A pulse wave with 1% duty cycle has CF = 10.0, while impulse waveforms can have CF > 100. Square waves have the lowest CF = 1.0.
Practical Applications of Crest Factor
1. Audio Engineering and Music Production
Dynamic Range Management:
In audio, crest factor indicates the dynamic range of a signal:
Typical Values:
- Sine wave tone: CF = 1.414 (3 dB)
- Speech: CF = 4-10 (12-20 dB)
- Classical music: CF = 10-20 (20-26 dB)
- Rock/Pop music: CF = 4-8 (12-18 dB)
- Drum hits: CF = 10-20+ (20-26+ dB)
Applications:
- Headroom: Amplifiers need headroom for peaks
- CF of 10 requires 20 dB headroom
- Insufficient headroom causes clipping
- Compression: Reduces crest factor
- Limits peaks relative to average
- Allows louder average levels
- Typical compressed music: CF = 4-6
- Metering:
- Peak meters show instantaneous peaks
- RMS meters show average power
- Crest factor = Peak/RMS
Example: A music track with:
- Peak level: 0 dBFS (full scale)
- RMS level: -14 dBFS
- Crest factor: 14 dB (ratio of 5.0)
2. Power System Design
Equipment Sizing:
Electrical equipment must handle peak voltages and currents:
Transformers:
- Insulation rated for peak voltage
- $V_{peak} = CF \times V_{RMS}$
- For sine wave: $V_{peak} = 1.414 \times V_{RMS}$
- Example: 480V RMS → 679V peak insulation required
Circuit Breakers:
- Must interrupt peak fault currents
- High CF waveforms require higher interrupting capacity
- Inrush currents can have CF > 10
Motor Drives:
- Inverters must supply peak currents
- High CF indicates harmonic distortion
- May require oversized semiconductors
Example Calculation:
A motor draws 100A RMS with CF = 2.5 (distorted waveform):
- Peak current: $I_{peak} = 2.5 \times 100 = 250A$
- Inverter must handle 250A peaks
- Conductor sizing based on RMS (100A)
- Protection devices rated for peaks (250A)
3. Signal Processing and ADCs
Analog-to-Digital Conversion:
ADCs must accommodate signal peaks without clipping:
Bit Depth Requirements:
For a sine wave (CF = 1.414):
- Dynamic range needed: 3 dB for peaks
- Standard: 6 dB headroom
For high-CF signals (CF = 10):
- Dynamic range needed: 20 dB for peaks
- Requires more bits or gain adjustment
Formula:
$\text{Bits needed} = \log_2(CF \times \text{SNR}_{required})$
Example:
- Signal CF = 5
- Desired SNR = 60 dB (1000:1)
- Peak-to-noise = 5 × 1000 = 5000:1
- Bits = $\log_2(5000) ≈ 12.3$ bits
- Use 14-16 bit ADC for margin
4. Telecommunications
OFDM (Orthogonal Frequency Division Multiplexing):
Modern wireless systems (WiFi, 4G/5G) use OFDM:
High Crest Factor Problem:
- Multiple subcarriers add constructively
- CF can reach 10-12 dB (3.2-4.0)
- Power amplifiers must handle peaks
- Reduces efficiency
Solutions:
- Clipping: Limits peaks (introduces distortion)
- Coding: Selects low-CF symbol combinations
- Predistortion: Compensates for amplifier nonlinearity
Impact:
- High CF → lower average power
- Reduced battery life in mobile devices
- Larger, more expensive amplifiers
5. Power Quality Analysis
Detecting Distortion:
Crest factor indicates waveform quality:
Healthy System:
- Voltage CF ≈ 1.414 (sine wave)
- Current CF varies with load
Problems Indicated by High CF:
Voltage:
- CF > 1.5: Harmonic distortion
- CF > 2.0: Severe distortion or transients
- Causes: Nonlinear loads, switching transients
Current:
- CF > 3: Typical for electronic loads
- CF > 5: Severe harmonics or arcing
- Causes: VFDs, rectifiers, arc furnaces
Example Diagnosis:
- Measured voltage CF = 1.8 (expected 1.414)
- Conclusion: Significant harmonic distortion
- Action: Install harmonic filter
Crest Factor Measurement and Instrumentation
Meter Crest Factor Rating
AC meters have a crest factor rating specifying the maximum CF they can accurately measure.
Typical Ratings:
- Basic multimeter: CF = 3
- Good quality DMM: CF = 5-10
- True RMS meter: CF = 3-10
- Power quality analyzer: CF = 10+
Error with Exceeded CF:
If signal CF exceeds meter rating:
- Meter underreads RMS value
- Error increases with CF
- Can be 10-50% or more
Example:
- Meter rated for CF = 3
- Signal has CF = 6
- Measured RMS may be 20% low
- Solution: Use higher-CF meter
Measuring Crest Factor
Method 1: Dual Measurement
- Measure peak value with oscilloscope or peak-reading meter
- Measure RMS value with True RMS meter
- Calculate: $CF = \frac{V_{peak}}{V_{RMS}}$
Method 2: Dedicated Crest Factor Meter
Some advanced meters directly display crest factor:
- Measures both peak and RMS simultaneously
- Calculates ratio automatically
- Useful for power quality surveys
Method 3: Oscilloscope
Modern digital oscilloscopes:
- Measure peak automatically
- Calculate RMS
- Display crest factor directly
- Show waveform for visual inspection
Practical Measurement Example
Problem: Measure the crest factor of a motor current waveform.
Equipment:
- Current probe (for oscilloscope)
- True RMS clamp meter
- Digital oscilloscope
Procedure:
- Connect current probe to oscilloscope
- Set appropriate scale (e.g., 10A/div)
- Trigger on waveform
- Measure peak current
- Oscilloscope shows $I_{peak} = 45A$
- Measure RMS current
- True RMS clamp meter shows $I_{RMS} = 25A$
- Calculate crest factor
- $CF = \frac{45}{25} = 1.8$
- Interpret result
- Expected for motor: CF = 1.4-2.0
- Result (1.8) indicates some harmonic content
- Within normal range
Practical Examples and Calculations
Example 1: Amplifier Headroom Calculation
Problem: Design an audio amplifier for a music signal with crest factor of 8. The average power requirement is 50W into 8Ω. Calculate the peak power and required supply voltage.
Solution:
Given:
- Average power: $P_{avg} = 50W$
- Load: $R = 8\Omega$
- Crest factor: $CF = 8$
Step 1: Calculate RMS voltage
$P_{avg} = \frac{V_{RMS}^2}{R}$
$V_{RMS} = \sqrt{P_{avg} \times R} = \sqrt{50 \times 8} = \sqrt{400} = 20V$
Step 2: Calculate peak voltage
$V_{peak} = CF \times V_{RMS} = 8 \times 20 = 160V$
Step 3: Calculate peak power
$P_{peak} = \frac{V_{peak}^2}{R} = \frac{160^2}{8} = \frac{25,600}{8} = 3,200W$
Step 4: Calculate supply voltage
For dual supply (±V):
$V_{supply} \geq V_{peak} = 160V$
Use ±170V supply for margin
Result:
- Average power: 50W
- Peak power capability needed: 3,200W
- Supply voltage: ±170V
- Note: High CF requires massive peak power capability!
Example 2: Transformer Sizing for High-CF Load
Problem: A rectifier load draws 100A RMS with a crest factor of 3.0. Size the transformer secondary winding.
Solution:
Given:
- $I_{RMS} = 100A$
- $CF = 3.0$
Step 1: Calculate peak current
$I_{peak} = CF \times I_{RMS} = 3.0 \times 100 = 300A$
Step 2: Conductor sizing
Based on RMS current and temperature rise:
- Use 100A-rated conductor
- Check temperature rise at 300A peaks (short duration OK)
Step 3: Insulation and clearances
Must withstand peak voltage:
- If $V_{RMS} = 240V$
- $V_{peak} = 1.414 \times 240 = 340V$ (assuming sine voltage)
- Use 600V insulation for margin
Step 4: Thermal rating
Transformer kVA based on RMS:
$kVA = V_{RMS} \times I_{RMS} = 240 \times 100 = 24 kVA$
Result:
- Transformer: 24 kVA, 240V secondary
- Conductor: 100A continuous rating
- Insulation: 600V minimum
- Must handle 300A peak currents
Example 3: ADC Selection for Signal Acquisition
Problem: Select an ADC for measuring a signal with crest factor of 6 and required SNR of 50 dB. The signal amplitude is ±5V.
Solution:
Given:
- $CF = 6$
- Required SNR = 50 dB
- Signal range: ±5V
Step 1: Calculate peak-to-RMS ratio in dB
$CF_{dB} = 20 \log_{10}(6) = 15.56 \text{ dB}$
Step 2: Total dynamic range needed
$DR_{total} = SNR + CF_{dB} = 50 + 15.56 = 65.56 \text{ dB}$
Step 3: Calculate bits required
Each bit provides ≈ 6 dB dynamic range:
$\text{Bits} = \frac{65.56}{6} = 10.9$
Step 4: Select ADC
- Minimum: 11 bits
- Recommended: 12-14 bits for margin
- Choose: 14-bit ADC (84 dB dynamic range)
Step 5: Verify
14-bit ADC: $DR = 6 \times 14 = 84 \text{ dB}$
Available for signal: $84 – 15.56 = 68.44 \text{ dB}$
Required: 50 dB ✓
Result: Use 14-bit ADC with ±5V input range.
Summary and Conclusion
Crest factor is a fundamental parameter that reveals the peak-to-RMS relationship of waveforms, with critical implications across electrical engineering, audio, telecommunications, and power systems.
Key takeaways from this guide include:
- Definition: Crest factor = Peak value / RMS value (dimensionless, ≥ 1.0)
- Common Values:
- Square wave: CF = 1.0 (lowest)
- Sine wave: CF = 1.414 (√2)
- Triangle/Sawtooth: CF = 1.732 (√3)
- Half-wave rectified: CF = 2.0
- Pulse waves: CF = 1/√D (varies with duty cycle)
- Complex waveforms: CF > 1.414 (indicates distortion)
- Practical Significance:
- Equipment Sizing: Must handle peak voltages/currents
- Dynamic Range: Determines headroom requirements
- Power Quality: High CF indicates harmonics or transients
- Measurement: Meters must have adequate CF rating
- Efficiency: High CF reduces system efficiency
- Applications:
- Audio: Managing dynamic range and preventing clipping
- Power Systems: Transformer and conductor sizing
- Signal Processing: ADC selection and gain staging
- Telecommunications: OFDM and amplifier design
- Motor Drives: Inverter and semiconductor sizing
- Measurement:
- Use True RMS meters with adequate CF rating
- Oscilloscopes provide direct peak and RMS measurements
- CF > meter rating causes measurement errors
- Design Implications:
- High CF requires larger safety margins
- Increases equipment cost and size
- Reduces efficiency
- May require special design considerations
Understanding crest factor enables engineers to:
- Design systems with appropriate headroom
- Select properly-rated measurement instruments
- Diagnose power quality issues
- Optimize system efficiency
- Prevent distortion and equipment damage
Whether you’re designing an audio amplifier, sizing a transformer, selecting an ADC, or troubleshooting power quality issues, crest factor provides essential insights into waveform behavior that RMS and peak values alone cannot reveal. Mastering this concept is crucial for anyone working with AC systems, signal processing, or electrical measurements.